Attendance Chart
The Attendance-Chart component provided is a reusable component designed to display attendance data in the form of a bar chart.It is accesible through the TNP Website.
Adding Attendance Chart
Let's understand how to add the Attendance Bar Chart to the Page
Opening
index.tsxof theAttendance-Chartcomponent file in our projects root directory.Define the
AttendanceChartcomponent using theReact.FCtype. It accepts props oftype { data: ChartData<"bar">, title: string }. Thedataprop represents the chart data, and thetitleprop represents the chart title.index.tsxconst AttendanceChart: React.FC<{
data: ChartData<"bar">;
title: string;
}> = ({ data, title }) => {
// Component code goes here
};Render the
Barcomponent fromChart.jswithin the<div>element. Pass thedataprop to provide the chart data, and use theoptionGeneratorfunction to generate the `chart options based on thetitle` prop.index.tsx<Bar data={data} options={optionGenerator(title)} />Save the file.
Run
yarn devon the terminal to see the changes made in your local environment.
On executing the above steps, the individual attendance bar charts look like this:
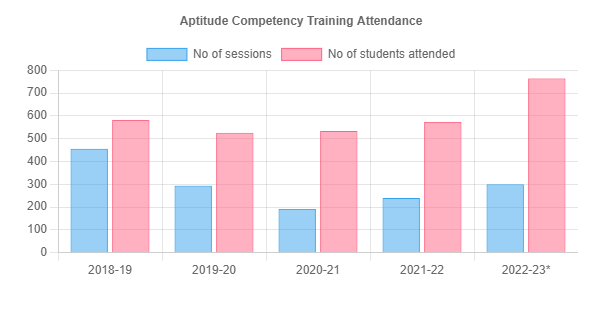
We inserted this Attendance Chart in many of our events and other pages of TNP Website. Next we will be seeing on how we integrated the Placements component.