Cycle Display
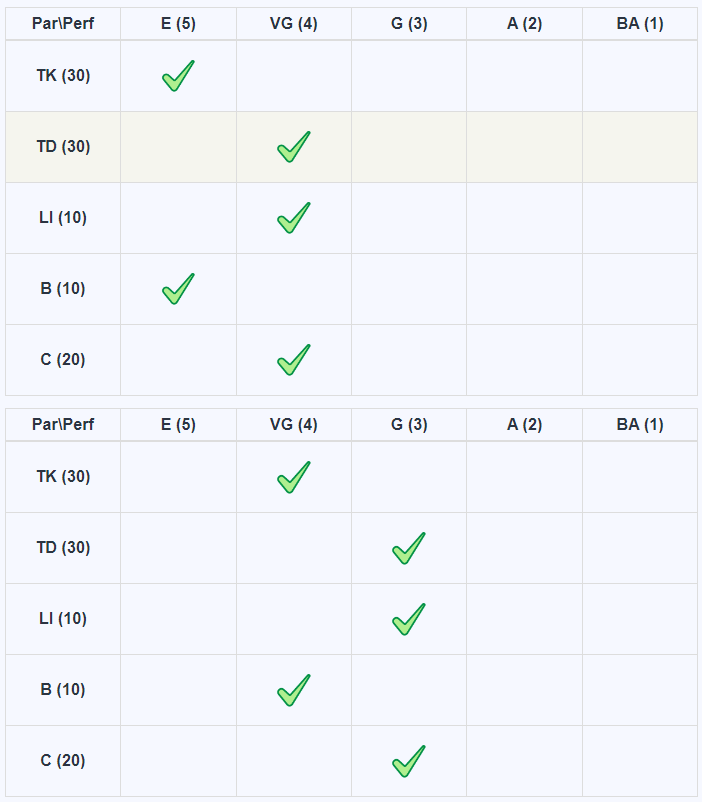
In Cycle Display component user will be able to see the break down of the average marks scored by them as tickmarks on various cells.
As you may see in the image:
Breakdown of the code is as follows:
Column Header
<th>: We have used<th>tag to define the column headers for the table, which are "Par\Perf", "E (5)", "VG (4)", "G (3)", "A (2)", and "BA (1)".We have used class attribute to apply CSS to the cells.
index.html<thead>
<tr>
<th>Par\Perf</th>
<th class="c">E (5)</th>
<th class="c">VG (4)</th>
<th class="c">G (3)</th>
<th class="c">A (2)</th>
<th class="c">BA (1)</th>
</tr>
</thead>
Data Column
<tr>: We have used<tr>element to define a row in an HTML table.<th>: We have used<th>tag to define the column header ie "1 to 5" on line 2.<td>: We have used<td>tag to define the remaining cells. These rows are used as template for adding actual data to the table.index.html<tr>
<th>TK (30)</th>
<td></td>
<td></td>
<td></td>
<td></td>
<td></td>
<td></td>
</tr>
Similarly we have implemented next column: TD (30) , LI (10) , B (10) and C (20) column.
After successfully implementing the Cycle Display component of the Fill my cycle website, the next step we did was to move forward with the implementation of Cycle Result component.